Yes, you can use Desmos for calculus, primarily as a powerful visualization tool. It excels at graphing functions, derivatives, and integrals, which helps build a strong conceptual understanding. While it doesn’t perform symbolic calculations like a CAS calculator, it is an invaluable free resource for students to explore and check their work.
Calculus can seem difficult with its abstract ideas, complex equations, and detailed graphs. Fortunately, powerful calculator tools are now available to help students and professionals work through it. One of the most helpful tools is Desmos, a user-friendly online graphing calculator. But how much can this platform really help you when tackling advanced topics?
This guide explores Desmos calculus, showing how it can be used for much more than basic graphing. We’ll cover how to visualize limits, find derivatives and tangent lines, and evaluate definite integrals. We will also show how to use Desmos as a practice tool for exams like the AP Calculus. While Desmos provides excellent visual aid and computing power, understanding its strengths and weaknesses is key to using it well.
Whether you’re struggling to picture a derivative or need to see the area under a curve, Desmos can make these concepts clear. Join us as we show you how to use Desmos for calculus, turning difficult problems into simple, visual solutions. Let’s start with the basic question: can you truly do calculus on Desmos?
Can you do calculus on Desmos?
Yes, you can do many calculus tasks on Desmos. It’s a great online graphing calculator that helps you visualize calculus concepts. Desmos is best for graphing and getting close estimates, but it also gives you a solid way to understand key ideas.
Many students love its interactive style. It turns abstract math ideas into moving visuals, which makes tricky topics easier to understand. Our platform, eLearnSmart, adds to this with over 100 professional calculators, giving you more specialized tools for school.
Graphing Functions and Visualizing Limits
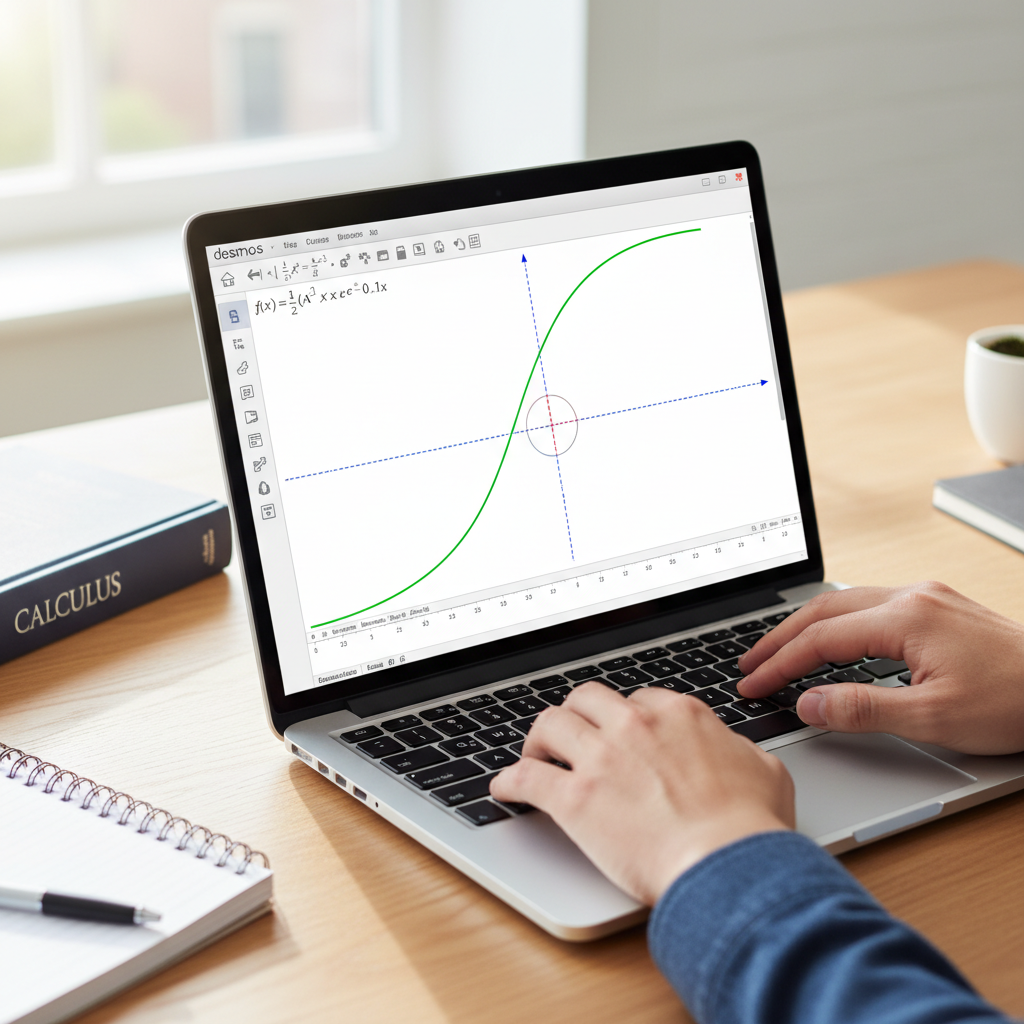
Desmos is famous for its great graphing tools. This is a key feature for calculus students because it lets you see how functions behave.
You can easily plot any function to see its curve, where it crosses the axes, and its asymptotes. This visual insight is a basic first step that helps you build a good feel for the math.
Desmos makes it easy to see limits. You can check how a function acts as ‘x’ gets closer to a certain value. You can also explore what happens when ‘x’ gets very large (limits at infinity).
Here’s how Desmos helps you see limits:
- Plot the function: Just type your function, like
f(x) = (sin(x))/x. - Observe points of interest: Zoom in on a key value. For our example, that’s where x=0.
- Use sliders: Add a slider for a variable, like ‘a’. Then, plot the point
(a, f(a)). As you move the slider for ‘a’, you can watch the point get closer to the limit. - Graph vertical lines: Draw
x = cto highlight specific x-values.
Exploring the graph this way makes limits less confusing. It shows you exactly why a function gets closer to a certain value. For example, you can clearly see that the limit of (sin(x))/x as x nears 0 is 1 [1].
Finding Derivatives and Tangent Lines
Desmos is great for finding and showing derivatives. This is another helpful tool for calculus that helps you understand the idea of an instant rate of change.
You can plot the derivative of any function directly. Desmos uses a prime mark (‘) for this. For example, if you have f(x), just type f'(x). This will show the graph of its first derivative.
It’s also simple to see tangent lines. A tangent line shows the instantaneous slope at a point, and Desmos makes this idea very interactive.
Steps to see derivatives and tangent lines:
- Define your function: Enter
f(x) = x^2. - Plot the derivative: Type
f'(x)in a new line. Watch how the derivative graph connects to the original one. - Choose a point: Create a slider for ‘a’. Plot the point
(a, f(a))on the original function. - Draw the tangent line: The formula for the tangent line at
x=aisy - f(a) = f'(a)(x - a). Type this into Desmos.
When you move the slider for ‘a’, you’ll see the tangent line change in real time. This helps you see what the derivative really means and shows how the slope changes along the curve [2].
Exploring the Fundamental Theorem of Calculus
Desmos has great tools to help you understand the Fundamental Theorem of Calculus (FTC). This theorem connects derivatives and integrals and is a very important part of calculus.
While Desmos can’t solve integrals with symbols, it’s amazing for visuals. You can see the connection between a function and the graph of its antiderivative. This helps you understand the core idea.
You can use Desmos to graph an integral using numbers. To do this, you usually set up an integral from a fixed number to a variable. For example, you can plot \int_a^x f(t) dt. Desmos will then show the graph of this total area function.
Try these methods for exploring the FTC:
- Graphing definite integrals: Use the integral symbol to shade the area under a curve. For example,
\int_0^x (sin(t)) dt. This shows how the area adds up. - Comparing graphs: Plot a function
f(x)and its antiderivative. See how the slopes of the antiderivative match the values off(x). - Numerical approximations: You can also picture Riemann sums. Use lists and sums to estimate areas. This gives you a better feel for how integrals work.
By comparing the graph of f(x) to the graph of its integral, \int_a^x f(t) dt, you can see the FTC in action. For instance, where f(x) is positive, the integral function is increasing. Where f(x) is zero, the integral function has a horizontal tangent [3]. Seeing this on a graph makes the theory easier to remember.
Can Desmos do integrals?
How to Set Up and Graph Definite Integrals
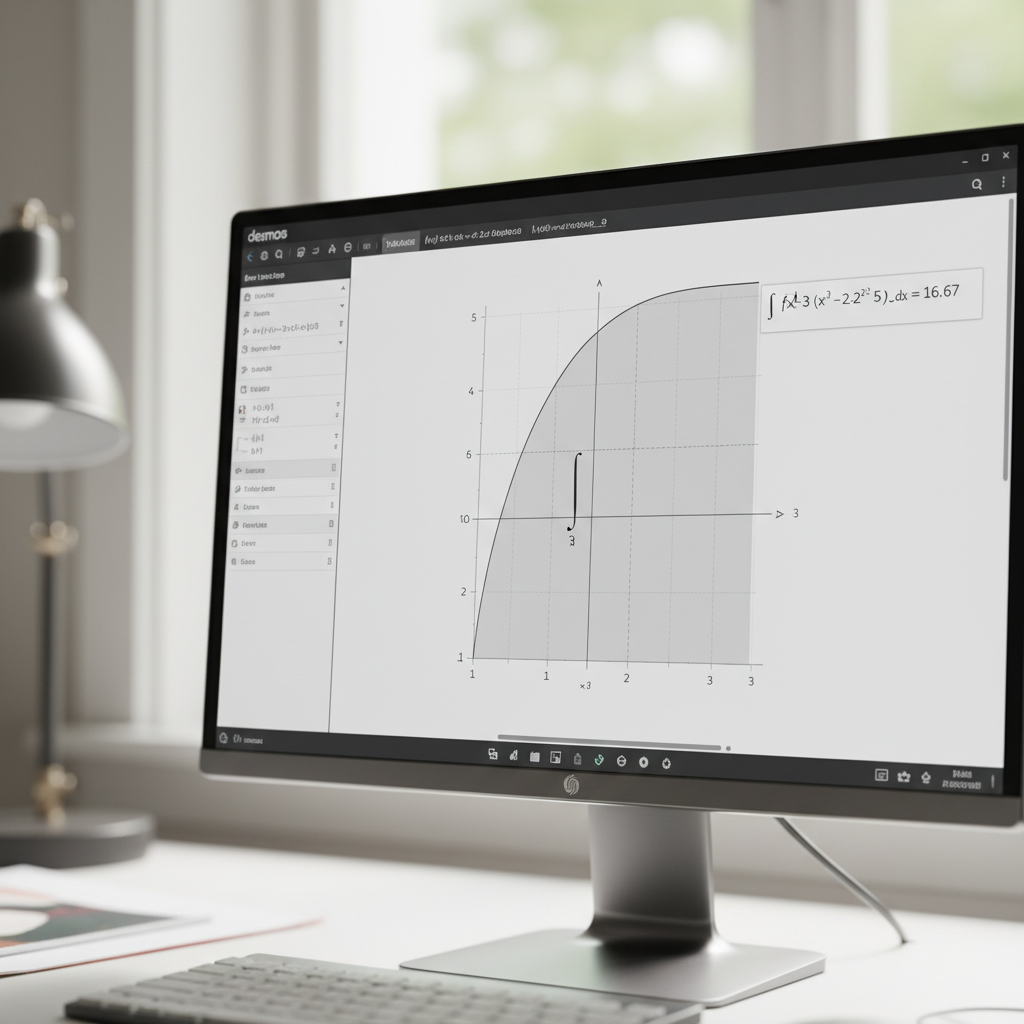
Yes, Desmos is great for handling definite integrals. It helps you see the area under a curve, which is what a definite integral represents. This visual approach makes calculus concepts much easier to grasp.
In Desmos, you can type an integral directly. The tool then calculates the answer and shades the area on the graph. This simple view makes hard problems easier to understand. It’s a fantastic tool for both teachers and students [4].
Here’s how to set up and graph a definite integral in Desmos:
- Define your function: First, enter the function you want to integrate. For example, type
f(x) = x^2. - Input the integral notation: In a new line, use the integral symbol. You can type
intand Desmos will automatically convert it to the integral symbol (∫). - Specify the limits: Add the lower and upper limits. For instance, to integrate from 0 to 2, you would type
int(f(x), x, 0, 2). - Observe the results: Desmos instantly shows the shaded area under the curve and provides the final calculated value.
This direct method saves time and helps you learn by connecting the math symbols to a clear picture. Desmos makes the idea of “accumulated change” easier to understand. For more advanced problems, our platform at eLearnSmart also offers a variety of powerful calculus calculators.
Approximating Area Under a Curve
Desmos is also a great tool for learning how to approximate the area under a curve. These approximation methods are used in many real-world engineering and science applications. With Desmos, you can watch these approximations change in real time.
You can set up methods like Riemann sums and the trapezoidal rule. While Desmos doesn’t have a “Riemann Sum” button, you can build these approximations yourself using its graphing and summation features. This interactive process helps you better understand how these methods work.
To visualize and approximate the area using Riemann sums:
- Define your function and interval: As before, start with
f(x)and your integration interval[a, b]. - Choose the number of rectangles (n): Make a slider for
n. This lets you easily change the number of rectangles used in the approximation. - Calculate delta x: Define
dx = (b-a)/n. This is the width of each rectangle. - Generate x-values for evaluation: For left Riemann sums, you might use
x_i = a + (i-1)dx. For right sums, usex_i = a + idx. You can generate these using lists. - Sum the areas: Use Desmos’s summation notation. For example, a left Riemann sum could be represented by
sum_{i=1}^{n} (f(a + (i-1)dx) * dx). - Graph the rectangles: Use lists or other functions to draw the rectangles on the graph. This step is key to seeing how the approximation works.
This hands-on method helps connect the picture on the graph to the calculated number. It’s especially helpful for students studying for tests like the AP Calculus exam [5]. Additionally, eLearnSmart offers specialized calculators that can perform these approximations quickly and accurately, which is great for more complex problems.
Is Desmos on the AP Calculus exam?
Official College Board Calculator Policy
It’s important for AP Calculus students to know the calculator rules. The College Board has clear guidelines for exam day. You must use an approved, physical graphing calculator [6]. While Desmos is a useful online tool, it is not allowed on the official AP Calculus AB or BC exams.
This means you cannot use Desmos during the test. Test administrators have strict rules to keep the exam fair for everyone. Therefore, you must be comfortable using an approved physical calculator. Knowing its functions—like graphing, solving equations, and calculating values—is key to success.
Using Desmos Effectively for Exam Practice
Even though Desmos isn’t allowed on the AP Calculus exam, it is a great study tool. It helps you better understand calculus concepts by letting you explore problems and check your work. Its excellent visuals can make learning much easier.
Here are key ways to use Desmos for AP Calculus exam practice:
- Visualize Functions: Quickly graph complex functions to see their behavior, asymptotes, and points of intersection. This will improve your skills in reading and understanding graphs.
- Check Your Work: After solving a problem by hand, use Desmos to check your answer. You can plot derivatives or integrals and compare the graph to your results. This helps build confidence in your calculus skills.
- Understand Concepts: Use Desmos to see concepts in action. You can explore limits, watch how tangent lines work, and visualize the area under a curve. It helps connect abstract ideas to real graphs.
- Experiment with Parameters: Change parts of a function and watch how the graph changes in real-time. This helps you build a better intuition for mathematical relationships.
Remember, you must be skilled with your physical graphing calculator for the actual exam, so practice with it regularly. For additional practice, eLearnSmart offers over 100+ free calculator tools. Our platform can help you master various math concepts, refine skills beyond basic graphing, and prepare for any challenge.
What are the cons of Desmos?
Lack of Symbolic Calculation (CAS)
Desmos is well-known for its excellent graphing tools. It’s great at visualizing functions and data. However, it is a graphing calculator, not a Computer Algebra System (CAS).
A CAS, by definition, works with math symbols, not just numbers. It can handle complex algebra, find derivatives, and solve integrals symbolically. [7]
Desmos, on the other hand, provides numerical and graphical answers. It calculates specific values and plots them on a graph.
So, what does this difference mean for calculus students?
- You can’t ask Desmos to symbolically differentiate
f(x) = x³and get3x². - It also won’t give you
(x²)/2 + Cfor the indefinite integral∫x dx. - It can’t solve an equation like
x² - 9 = 0using algebra. Instead, you would graphy = x² - 9and find where it crosses the x-axis.
This means Desmos can’t show you the algebraic steps behind an answer. It helps you see the problem and check your numbers, but it doesn’t perform the symbolic work for you.
Limitations Compared to Dedicated Solvers
Dedicated math solvers offer many more features. Tools like WolframAlpha, Symbolab, and professional software like Maple have powerful CAS functions built-in. [8]
Desmos focuses on graphing and calculating numbers. These are its main strengths.
However, its abilities are limited compared to these specialized platforms.
- Step-by-step Solutions: Desmos doesn’t show the steps to solve a problem. Other solvers often do, which is a huge help for understanding calculus.
- Advanced Topics: It is not built for advanced topics like multivariable calculus (beyond basic 3D plots), differential equations, series, or complex analysis.
- Symbolic Manipulation: You can’t use Desmos to simplify complex algebraic expressions. It won’t take a messy equation and return a cleaner, symbolic version.
These differences matter. To truly learn the concepts, students often need to see the full algebraic steps, not just the final graph or number.
When to Use an Alternative Calculator
Desmos is a great visual tool for exploring calculus. But sometimes, you’ll need a calculator with different features.
Consider using a different tool in these situations:
- You need the exact symbolic derivative of a function.
- You need to find a symbolic indefinite integral, including the constant of integration.
- You need to solve complex equations using algebra, not just by graphing.
- You want to see the step-by-step work for a calculus problem.
- You are working on advanced topics like multivariable calculus or differential equations.
- You need to simplify a complex algebraic expression.
For these tasks, a dedicated symbolic calculator is essential. Our platform, eLearnSmart, offers over 100+ free professional calculators. Many of these provide step-by-step solutions and cover a wide range of math topics. They are designed to fill the gaps where Desmos falls short. Explore our diverse tools for a complete learning experience.
How Does Desmos Compare to Other Tools?
Desmos vs. Symbolab
Desmos and Symbolab both help with calculus, but they have different goals. Desmos is great for exploring math visually. Its interactive graphs help you see and understand ideas like limits, derivatives, and integrals. It also has a clean, easy-to-use design.
Symbolab, on the other hand, is more of a step-by-step problem solver. It gives detailed answers for many types of math problems, including algebra, pre-calculus, and calculus. Many students find its explanations very helpful for learning how to solve problems [9].
Here are the key differences:
- Visual Learning: Desmos is better for graphing and seeing functions.
- Step-by-Step Solutions: Symbolab gives detailed, step-by-step answers.
- User Interface: Desmos usually has a simpler, more friendly design.
- Problem Scope: Symbolab covers a wider range of specific problem types.
Desmos helps you understand concepts by interacting with graphs. In contrast, Symbolab helps you master the steps to solve problems.
Desmos vs. WolframAlpha
WolframAlpha is a powerful tool that computes answers. It’s very different from Desmos. Desmos is an interactive graphing calculator, while WolframAlpha calculates answers using data from many different subjects [10].
For calculus, WolframAlpha can handle symbolic math, like derivatives and integrals. It gives you answers but also shows properties and other related info, like series expansions. Desmos is great for graphing, but it can’t do this kind of advanced math.
Here’s a comparison:
- Interactive Graphing: Desmos gives you a smoother, more direct graphing experience.
- Symbolic Computation: WolframAlpha is excellent for complex algebra and symbolic math.
- Scope: WolframAlpha covers almost any academic or real-world topic.
- Output Detail: WolframAlpha gives very detailed results and explanations.
If you need to see what a function looks like, Desmos is the perfect tool. If you need a deep calculation or detailed information, WolframAlpha is the better choice.
Desmos vs. GeoGebra
Desmos and GeoGebra are both powerful math tools with graphing features. However, GeoGebra offers a much wider set of tools [11].
Desmos is a simple, user-friendly graphing calculator. It’s easy to use for plotting functions and exploring calculus concepts visually. People often praise its simple design.
GeoGebra combines geometry, algebra, spreadsheets, graphing, statistics, and calculus all in one place. This makes it very flexible. It can even do 3D graphing. But with so many features, it can be harder to learn.
Here are the main differences:
- Ease of Use: Desmos is usually easier for beginners who just want to graph.
- Tool Integration: GeoGebra puts geometry, algebra, and calculus in one place.
- 3D Capabilities: GeoGebra has strong 3D graphing tools, which Desmos doesn’t.
- Feature Set: GeoGebra has a more complete set of math tools.
For plotting a function quickly, Desmos is excellent. For an all-in-one math tool, GeoGebra is more powerful.
Why eLearnSmart’s Calculators Offer More
While Desmos is great for graphing, eLearnSmart offers a much wider range of tools. Our platform has over 100+ professional calculators that cover 13 school subjects. This includes special calculators for calculus, algebra, and more.
Many of our calculators have advanced features that go beyond basic graphing. For example, they give step-by-step solutions to hard problems. Our AI tutor works with these tools, giving you personalized help and guidance to help you master any subject.
Here’s what makes eLearnSmart different:
- Vast Tool Library: Get over 100 specialized calculators for many different needs.
- Comprehensive Coverage: Find tools for all major school subjects.
- Advanced Calculus Solvers: Use special calculators built for calculus problems.
- AI-Powered Tutoring: Get instant, personalized help and explanations.
- All-in-One Platform: Find every tool you need in one easy-to-use place.
Desmos is a great graphing tool, but eLearnSmart is a complete learning system. Our platform gives students everything they need to succeed in school. Our free tools help you learn everything you need to know and offer solutions for any calculation problem.
Frequently Asked Questions
Can you do calculus on Desmos?
Yes, Desmos is a great tool for exploring many calculus concepts. It is excellent at showing graphs, which helps you understand core ideas. While it’s mainly a graphing calculator, it has powerful features for seeing calculus in action.
You can use Desmos to:
- Graph functions: See what complex functions look like and how they behave.
- Explore limits: Watch what happens to a function as a variable gets closer to a certain value.
- Graph derivatives: Plot a function’s derivative to understand tangent lines.
- Visualize the Fundamental Theorem of Calculus: See the connection between derivatives and integrals on a graph.
However, Desmos does not solve calculus problems using algebra, like finding the formula for an integral or a derivative. For those tasks, eLearnSmart offers over 100 specialized calculus calculators that give you step-by-step answers, working well alongside the graphs you make in Desmos.
Is Desmos on the AP Calculus exam?
Yes, Desmos is an approved calculator for the AP Calculus AB and BC exams. The College Board officially allows it as a tool [source: https://apstudents.collegeboard.org/ap/2020-21/ap-exams-2021-calculus-calculator-information.pdf].
It’s important to know:
- The College Board includes a built-in Desmos calculator on the digital exam platform.
- You cannot use your personal Desmos account or saved graphs during the test.
- Getting used to the exam version of Desmos is key to doing your best.
Many students find Desmos very helpful for graphing, solving equations, and checking answers on the parts of the exam where calculators are allowed. It’s a strong tool for solving problems visually during the test.
What are the cons of Desmos?
While Desmos is a great tool, it has some limitations. Knowing these limits helps you choose the right tool for your task. The main downsides include:
- It can’t do algebra with calculus problems (CAS): Desmos is not a Computer Algebra System. This means it can’t find the general formula for a derivative or integral. For example, it won’t tell you the indefinite integral of
x^2is(1/3)x^3 + C. - Fewer advanced tools: Compared to other math software like WolframAlpha or our eLearnSmart calculus calculators, Desmos can’t handle some higher-level problems. This includes solving difficult differential equations or doing vector calculus.
- No step-by-step solutions: Desmos gives you the final answer as a number or a graph but doesn’t show the work. This can make it harder to learn the steps for solving a problem.
When you need to see the algebra behind a problem or get step-by-step answers, other tools are a better fit. Our eLearnSmart platform offers over 100 free calculator tools that show you how to solve advanced calculus problems from start to finish.
Can Desmos do integrals?
Yes, Desmos is great for working with definite integrals. It is especially good at helping you see what an integral represents visually.
Here’s how Desmos helps with integrals:
- Calculate definite integrals: You can type in a definite integral to find the numerical value of the area under a curve.
- See the area: Desmos can shade the area that the integral represents, which makes the “area under the curve” concept easy to see.
- Understand area approximations: You can use Desmos to graph Riemann sums (the rectangles used to estimate area). This is a great way to see how integrals work.
However, Desmos cannot find the formula for an indefinite integral (the general antiderivative). For that kind of problem, or for integrals that need more advanced steps, you should use a dedicated integral calculator, such as the ones available free on our eLearnSmart platform.
Sources
- https://www.desmos.com/calculator/b8c0o32s2c
- https://help.desmos.com/hc/en-us/articles/202529249-Derivatives
- https://math.stackexchange.com/questions/3743387/how-do-i-graph-integrals-on-desmos
- https://www.desmos.com/calculator/2x2q4g2q9r
- https://apcentral.collegeboard.org/courses/ap-calculus-ab/exam
- https://apcentral.collegeboard.org/courses/ap-calculus-ab/exam/calculator-policy
- https://mathworld.wolfram.com/ComputerAlgebraSystem.html
- https://www.maplesoft.com/products/maple/
- https://www.symbolab.com/solver/calculus-calculator
- https://www.wolframalpha.com/
- https://www.geogebra.org/